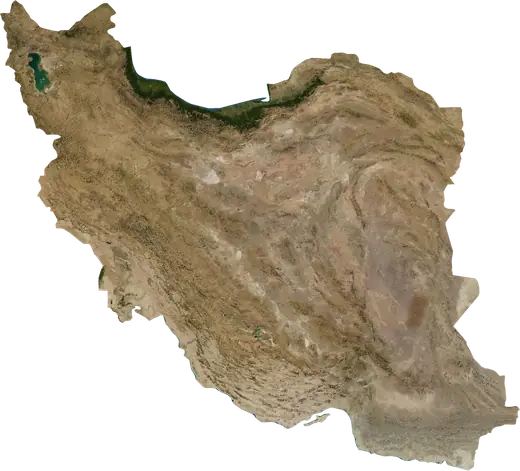
 Razavi Khorasan
Earthquakes in Razavi Khorasan
Latest earthquakes in Razavi Khorasan (Iran), the strongest recorded, statistics and nearby places.
Live map – Razavi Khorasan
Loading live map…
Latest eventM 4.26.2 mi depth · 68 days ago30 mi NNE of Kashmar, Iran
Low
Moderate
High
Very high
Extreme
Very extreme
Forecast: Copernicus EFFIS (FWI index)
Very light rain (0.1–1 mm)
Light rain (1–5 mm)
Moderate rain (5–10 mm)
Heavy rain (10–25 mm)
Very heavy rain (25–50 mm)
Extreme rain (≥ 50 mm)
Forecast: ECMWF via Copernicus EMS – GWIS
Calm (< 7 km/h, 0–1 Bf)
Light breeze (7–18 km/h, 2–3 Bf)
Moderate breeze (18–36 km/h, 4–5 Bf)
Strong breeze (36–54 km/h, 5–7 Bf)
Gale (54–72 km/h, 7–8 Bf)
Storm (≥ 72 km/h, 9+ Bf)
Forecast: ECMWF via Copernicus EMS – GWIS
Very low lightning
Low lightning
Moderate lightning
High lightning
Very high lightning
Extreme lightning
Forecast: ECMWF via Copernicus EMS – GWIS
Earthquakes
Wildfires
Floods
Storms
Volcanoes
Tsunamis
Key statistics (30 days)
Earthquakes M2.5+ and the wildfire fronts shown on the map.
Recent events in Razavi Khorasan
- 4.268 days agoM4.2 earthquake near Kashmar, Iran30 mi NNE of Kashmar, Iran
- 4.472 days agoM4.4 earthquake near Bardaskan, Iran19 mi N of Bardaskan, Iran
- 4.299 days agoM4.2 earthquake near Neyshabur, Iran26 mi WSW of Neyshabur, Iran
- 4.5349 days agoM4.5 earthquake near Quchan, Iran12 mi WSW of Quchan, Iran
Historical overview
Earthquakes M3.0+ and significant events of other hazards.
About Razavi Khorasan
Razavi Khorasan has recorded 144 earthquakes of magnitude 3.0 or more since 1976. The strongest was M6.1 in 2017.
Know the official emergency number, prepare an emergency kit and follow the instructions of your civil protection authority.
Learn more ›Earthquakes
144 earthquakes of magnitude 3.0 or more since 1976. The strongest was M6.1.
Recent earthquakes
| Mag | Location | Time (UTC) | Depth |
|---|---|---|---|
| 4.2 | 30 mi NNE of Kashmar, Iran | 6.2 mi | |
| 4.4 | 19 mi N of Bardaskan, Iran | 6.2 mi | |
| 4.2 | 26 mi WSW of Neyshabur, Iran | 6.2 mi | |
| 4.5 | 12 mi WSW of Quchan, Iran | 6.2 mi |
Strongest earthquakes on record
| Mag | Location | Time (UTC) | Depth |
|---|---|---|---|
| 6.1 | 59 mi SE of Mashhad, Iran | 8.1 mi | |
| 5.6 | 34 mi NNE of Chenaran, Iran | 20.5 mi | |
| 5.5 | 18 mi S of Sangan, Iran | 6.2 mi | |
| 5.5 | 47 mi NE of Torbat-e Jam, Iran | 16.1 mi | |
| 5.4 | 6 mi SE of Torbat-e Heydariyeh, Iran | 14.9 mi | |
| 5.4 | 51 mi SW of Sabzawār, Iran | 20.5 mi | |
| 5.3 | 6 mi NNE of Neyshabur, Iran | 5.0 mi | |
| 5.3 | 14 mi E of Bardaskan, Iran | 20.5 mi | |
| 5.3 | 51 mi SW of Sabzawār, Iran | 20.5 mi | |
| 5.3 | 13 mi SE of Kashmar, Iran | 20.5 mi | |
| 5.3 | 67 mi WSW of Bardaskan, Iran | 29.8 mi | |
| 5.2 | 18 mi NNE of Torbat-e Jam, Iran | 25.5 mi | |
| 5.1 | 16 mi SW of Dargaz, Iran | 6.2 mi | |
| 5.1 | 63 mi ESE of Mashhad, Iran | 6.2 mi | |
| 5.1 | 58 mi SE of Mashhad, Iran | 6.2 mi |
Earthquakes per year (M3.0+)
Year
| 2026 | 3 | M4.4 |
| 2025 | 6 | M4.8 |
| 2024 | 5 | M4.9 |
| 2023 | 3 | M4.9 |
| 2022 | 2 | M4.5 |
| 2021 | 5 | M5.1 |
| 2020 | 4 | M5.5 |
| 2019 | 1 | M4.1 |
| 2017 | 9 | M6.1 |
| 2016 | 3 | M4.5 |
| 2015 | 4 | M5.0 |
| 2014 | 2 | M4.3 |
| 2013 | 4 | M4.4 |
| 2012 | 4 | M5.3 |
| 2011 | 3 | M5.0 |
| 2010 | 4 | M5.4 |
| 2008 | 2 | M5.0 |
| 2007 | 2 | M4.2 |
| 2006 | 2 | M4.4 |
| 2005 | 3 | M4.5 |
| 2004 | 5 | M4.7 |
| 2003 | 3 | M5.2 |
| 2002 | 2 | M4.4 |
| 2001 | 1 | M4.3 |
| 2000 | 8 | M5.3 |
| 1999 | 6 | M5.5 |
| 1998 | 1 | M4.3 |
| 1997 | 7 | M4.7 |
| 1996 | 8 | M5.4 |
| 1995 | 3 | M4.9 |
| 1994 | 1 | M5.3 |
| 1993 | 1 | M4.9 |
| 1991 | 4 | M4.9 |
| 1990 | 2 | M4.6 |
| 1988 | 2 | M4.4 |
| 1985 | 1 | M5.6 |
| 1984 | 2 | M4.8 |
| 1983 | 1 | M4.3 |
| 1982 | 1 | M3.6 |
| 1980 | 2 | M4.6 |
| 1979 | 7 | M5.3 |
| 1978 | 1 | M4.5 |
| 1977 | 3 | M4.7 |
| 1976 | 1 | M3.7 |